Science and Engineering in Education
Insights and tools for understanding STEM education in England, brought to you by the Institute of Physics, the Royal Academy of Engineering and the Gatsby Foundation, in association with SchoolDash.
Analysis tools
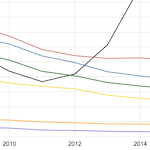
Line graphs
Variations in activity and attainment over time by qualification, subject, pupil type and school type
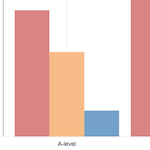
Column charts
Subject balance by educational stage, qualification, school type and year
Scatter plots
Patterns and relationships across multiple educational factors, by school or geographical area

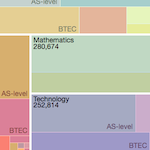
Treemaps
16-18 exam entries by STEM category, qualification and Sector Subject Area
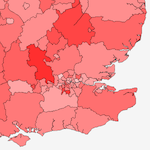
Maps
National and local patterns by geographical area
Important note
Every effort has been made to ensure the accuracy of the data presented here, but we cannot accept responsibility for errors or omissions however caused. If any of the information is important to you then please verify it independently.
Where to begin?
To see examples of the kinds of analyses that are possible using SEEdash, please visit our Gallery. Links to further examples are also provided at the foot of each analysis tool page.